Wear of Ultra-high Pressure Gate Valves
Introduction
Gate valves are important components in wellhead devices for oil and gas production. The shape of the inner cavity of gate valves are complex, and the fluid medium will produce vortex and backflow when flowing through the runner, which will aggravate the corrosion, vibration and wear of the inner cavity of gate valves, valve seats and valve bodies, and reduce the service life of gate valves. The valve body and the gate are the core parts of ultra-high pressure gate valves, and erosion wear is one of the main damage forms of them. As an important sealing element in the opening and closing process of gate valves, the erosion and wear of its surface will directly affect the reliability of sealing. Therefore, it is necessary to study the erosion and wear of gate valves during opening and closing.
The surface of the solid material contacts with the solid particles in the fluid during the fluid flow, and the solid material is consumed during the contact. Erosion is caused by many factors, such as the velocity and properties of the fluid, the concentration, the size, the shape and the impact angle of particles in the fluid. At present, the following two methods are mainly used to improve the erosion wear on the surface of components: First, wear-resistant materials or plated wear-resistant materials are used to modify the wall to improve the wear resistance of the wall materials. The second is to change the cross-sectional shape of the runner to improve the flow field near the wall, reducing the velocity of particles and changing the impact direction, so as to reduce the erosion of particles on the wall.
In this article, a numerical simulation method is proposed to simulate the erosion behavior of gate valves and middle cavity runner with different opening degrees, and analyze the erosion position and its regular of gate valves with different opening degrees, so as to provide a reference for surface strengthening treatment of key components of gate valves.
Hydrodynamic model and erosion model
1. Hydrodynamic model
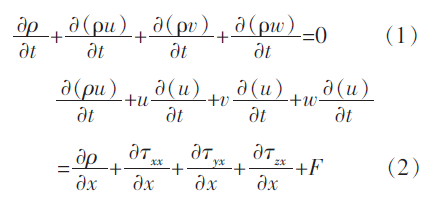
In the process of opening and closing the gate valve, the continuity equation and momentum of the medium flowing from the gate valve and the gate valve passage can be expressed by Formula (1) and Formula (2), where ρ is the liquid density, kg/m3. U, V and W are the velocity components in X, Y and Z directions, respectively, m/s. Xx, τyx and τzx are the surface forces on xx, yx and zx planes, Mpa respectively. F is the resultant force, n.
The opening and closing process of the gate valve can be solved by k-ε equation as follows:
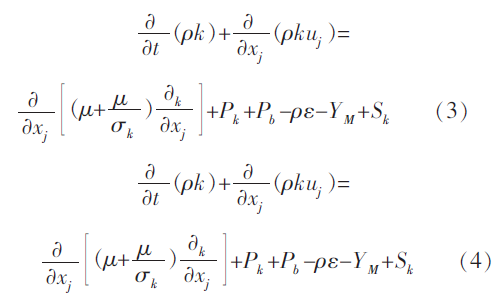
Pk and Pb represent turbulence kinetic energy, j. K represents turbulent pulsation energy, j. K is the dissipation rate of turbulent fluctuating kinetic energy,%. μ is the viscosity coefficient, Pa·s. YM is the fluctuation of compressible turbulent transition diffusion, j. Sk is a user-defined constant. σ ε and σK is turbulent Prantl number, and σ ε = 1.2; σK=1.0; C2e=1.9.
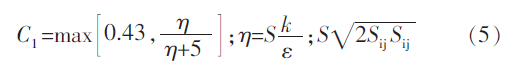
C1 is a constant, η is dynamic viscosity, m2/s. Sij is the strain rate in each direction.
2. Erosion model
Particle erosion is defined as the mass loss of wall materials per unit time per unit area, which can be expressed by formula (6):
Re is the erosion wear rate, kg/(m2s). Np is the number of particles. Mp is the mass flow rate, kg/s. C (dp) is the particle size function, of which dp is the particle diameter, mm. α is the impact angle between the path and the wall, rad. F(α) is a function of impact angle. V is the velocity relative to the wall, m/s. B(v) is a function of relative velocity. Af is the wall area, mm2.
The opening and closing flow channel of gate valves
1. Channel model
It is an ultrahigh-pressure open stem gate valve, as shown in Figure 1. The gate is connected with the valve stem by T-groove, and the metal floating self-sealing seal is used between the gate and the valve seat.

For the convenience of numerical simulation research, the parts unrelated to gate valves runners are simplified. As the fluid passes through the valve body through the horizontal runner, the switch at the gate will change the cross-section of the runner and affect the velocity of the fluid, and the erosion mainly occurs in the area near the gate. The simplified schematic diagram of the gate valve runner model is shown in Figure 2. In order to ensure that the particles and fluid phases are fully developed when flowing through the gate, 650mm-long channels are set at the upstream and downstream of the gate, with the diameter of the inlet and outlet of the valve body of 200 mm and the thickness of the gate of 46 mm.
The gate fluid calculation domain is divided into three parts, that is, the flow channel before the valve, the flow channel at the gate and the flow channel after the valve. The junction structure of the gate valve is complex, so this article uses tetrahedral mesh to classify the gate valve runner model. In order to ensure the accuracy of the calculation results, the ram and the pipe wall are separately encrypted. The mesh size is 5 mm, and the number of meshes is about 380,000.

Solution and boundary conditions
The analysis medium is water, and its density is 998.2 kg/m3. According to reference, the turbulence model adopts a realizable k-ε model, in which the near-wall surface adopts Scalable Wall Functions, the coupling of pressure and velocity adopts SIM PLEC algorithm, and momentum, turbulent kinetic energy and turbulent kinetic energy dissipation rate are discretized by the second-order upwind scheme.
The inlet boundary conditions are velocity inlet, turbulence intensity of 5% and hydraulic diameter of 0.05 m. The outlet boundary condition is the outflow boundary.
When the flow field analysis of the gate valve is carried out, the inlet velocity is 5 m/s, and the diameter of solid particles is 100 μm. The opening of the gate valve is set to 10%, 30%, 50%, 70% and 90% respectively. The solid-liquid two-phase flow method is used to simulate the erosion behavior in gate valves.
Results and analysis
1. Particle trajectories with different openings
According to the definition of valve opening, that is, opening = actual stroke/full-open stroke. The cross-sectional area of the valve flow section under different openings is calculated, and the cross-sectional area ratio of 10%, 30%, 50%, 70% and 90% opening is about 1:5:10:15:20. Assuming that the gate valve is leak-free, it can be considered that the flow of fluid into and out of the gate valve is strictly conserved: V1A1=V2A2 (7)
V1 is the average velocity of the valve inlet, m/s. A1 is the cross-sectional area perpendicular to the average speed direction, m2. V2 is the average velocity on the flow section of the valve, m/s. A2 is the flow cross-sectional area of the valve, m2.
It can be seen from formula (7) that the smaller the opening of the gate valve is, the greater the velocity through the bottom of the gate valve is, so the high-speed jet will appear in the downstream channel of the gate valve. When the opening is 10%, the average velocity on the flow section of the valve is about 20 times that of the inlet. The distribution of particle trajectories with different openings is shown in Figure 3.

From the chart of particle trajectory in Figure 3, it can be seen that the internal flow field of the gate valve is greatly influenced by the opening of the gate valve, and the particle trajectory changes sharply when the fluid flows through the gate valve, which is consistent with the theoretical situation of the flow conservation equation. When the opening is 10% and 30%, there is an obvious recirculation zone upstream of the shutter, but with the increase of the opening, the flow area of the fluid increases, and the velocity of the fluid passing through the lower end of the shutter decreases. When the opening is 70% and 90%, there is no obvious recirculation zone.
2. Erosion wear of different openings
The following figure is the distribution diagram of the erosion rate of gate valves under different opening conditions. It can be seen from Figure 4 that the valve opening has an influence on the degree and position of erosion wear. When the opening is 10%, the most serious position of erosion wear is located at the upstream end of the gate joint, and the erosion rate is the largest compared with other openings. When the opening of the gate valve is 30%, the erosion wear is mainly strip-shaped, and the upstream wall near the gate valve is the most widely distributed, but the maximum erosion rate is lower than the opening of 10%. This is because the flow cross-section of the gate valve increases, and the flow velocity of fluid decreases relatively. The disturbance to the movement of solid particles weakens. When the opening of the gate valve is 50% and 70%, the distribution of the two kinds of erosion wear is roughly the same, the erosion position is mainly concentrated near the gate valve, and the maximum erosion rate is similar. The reason is that the velocity change at the bottom of the gate is not much different when the opening of fluid is 50% and 70%. When the opening of the gate valve is 90%, the erosion wears mainly occurs at the bottom of the gate valve upstream of the runner, and there is no obvious erosion wear downstream of the runner. Generally speaking, under different opening conditions, the main erosion areas of gate valves are mainly concentrated at the bottom of gate valves and the sealing surface of gate valve seats.
Fig. 5 shows the change in the erosion rate of discs under different opening conditions. With the increase of the valve opening, the maximum erosion rate of gate valves shows a trend of first decreasing, then stabilizing and then continuing to decrease. When the valve opening is 10%, the erosion rate is the largest. When the opening is around 50%, the erosion rate has no obvious change. The above analysis shows that the erosion of gate valves is the most obvious in the process of opening and closing gate valves. In actual use, the opening and closing time of gate valves should be shortened as much as possible, so as to avoid leakage caused by erosion and wear accumulation of disc sealing surface. The above analysis also shows that the erosion wear phenomenon exists in the whole process of gate valves opening and closing, and the gate valve should not be used to regulate the flow in the field, so as to ensure that the gate valve is fully open or fully closed state and prolong the service life of the gate valve.
Conclusion
In this article, aiming at the erosion behavior of ultra-high pressure gate valves, the particle trajectory and erosion rate under 10%, 30%, 50%, 70% and 90% opening are analyzed, and the conclusions are as follows:
1. With the increase of the gate valve opening, the erosion rate will decrease at first and then remain unchanged.
2. The erosion rate of the gate valve is the largest during the opening and closing process.
3. During the opening and closing of the gate valve, there is erosion in the whole process of the gate valve, and the gate valve should be fully opened or closed as quickly as possible.
Gate valves are important components in wellhead devices for oil and gas production. The shape of the inner cavity of gate valves are complex, and the fluid medium will produce vortex and backflow when flowing through the runner, which will aggravate the corrosion, vibration and wear of the inner cavity of gate valves, valve seats and valve bodies, and reduce the service life of gate valves. The valve body and the gate are the core parts of ultra-high pressure gate valves, and erosion wear is one of the main damage forms of them. As an important sealing element in the opening and closing process of gate valves, the erosion and wear of its surface will directly affect the reliability of sealing. Therefore, it is necessary to study the erosion and wear of gate valves during opening and closing.
The surface of the solid material contacts with the solid particles in the fluid during the fluid flow, and the solid material is consumed during the contact. Erosion is caused by many factors, such as the velocity and properties of the fluid, the concentration, the size, the shape and the impact angle of particles in the fluid. At present, the following two methods are mainly used to improve the erosion wear on the surface of components: First, wear-resistant materials or plated wear-resistant materials are used to modify the wall to improve the wear resistance of the wall materials. The second is to change the cross-sectional shape of the runner to improve the flow field near the wall, reducing the velocity of particles and changing the impact direction, so as to reduce the erosion of particles on the wall.
In this article, a numerical simulation method is proposed to simulate the erosion behavior of gate valves and middle cavity runner with different opening degrees, and analyze the erosion position and its regular of gate valves with different opening degrees, so as to provide a reference for surface strengthening treatment of key components of gate valves.
Hydrodynamic model and erosion model
1. Hydrodynamic model
In the process of opening and closing the gate valve, the continuity equation and momentum of the medium flowing from the gate valve and the gate valve passage can be expressed by Formula (1) and Formula (2), where ρ is the liquid density, kg/m3. U, V and W are the velocity components in X, Y and Z directions, respectively, m/s. Xx, τyx and τzx are the surface forces on xx, yx and zx planes, Mpa respectively. F is the resultant force, n.
The opening and closing process of the gate valve can be solved by k-ε equation as follows:
Pk and Pb represent turbulence kinetic energy, j. K represents turbulent pulsation energy, j. K is the dissipation rate of turbulent fluctuating kinetic energy,%. μ is the viscosity coefficient, Pa·s. YM is the fluctuation of compressible turbulent transition diffusion, j. Sk is a user-defined constant. σ ε and σK is turbulent Prantl number, and σ ε = 1.2; σK=1.0; C2e=1.9.
C1 is a constant, η is dynamic viscosity, m2/s. Sij is the strain rate in each direction.
2. Erosion model
Particle erosion is defined as the mass loss of wall materials per unit time per unit area, which can be expressed by formula (6):
Re is the erosion wear rate, kg/(m2s). Np is the number of particles. Mp is the mass flow rate, kg/s. C (dp) is the particle size function, of which dp is the particle diameter, mm. α is the impact angle between the path and the wall, rad. F(α) is a function of impact angle. V is the velocity relative to the wall, m/s. B(v) is a function of relative velocity. Af is the wall area, mm2.
The opening and closing flow channel of gate valves
1. Channel model
It is an ultrahigh-pressure open stem gate valve, as shown in Figure 1. The gate is connected with the valve stem by T-groove, and the metal floating self-sealing seal is used between the gate and the valve seat.
Ultra-high pressure flat gate valves
1-valve stem 2- bonnet 3- valve body 4- valve seat 5- valve plate 6- tail-rod
For the convenience of numerical simulation research, the parts unrelated to gate valves runners are simplified. As the fluid passes through the valve body through the horizontal runner, the switch at the gate will change the cross-section of the runner and affect the velocity of the fluid, and the erosion mainly occurs in the area near the gate. The simplified schematic diagram of the gate valve runner model is shown in Figure 2. In order to ensure that the particles and fluid phases are fully developed when flowing through the gate, 650mm-long channels are set at the upstream and downstream of the gate, with the diameter of the inlet and outlet of the valve body of 200 mm and the thickness of the gate of 46 mm.
The gate fluid calculation domain is divided into three parts, that is, the flow channel before the valve, the flow channel at the gate and the flow channel after the valve. The junction structure of the gate valve is complex, so this article uses tetrahedral mesh to classify the gate valve runner model. In order to ensure the accuracy of the calculation results, the ram and the pipe wall are separately encrypted. The mesh size is 5 mm, and the number of meshes is about 380,000.
Channel model and grid division
Solution and boundary conditions
The analysis medium is water, and its density is 998.2 kg/m3. According to reference, the turbulence model adopts a realizable k-ε model, in which the near-wall surface adopts Scalable Wall Functions, the coupling of pressure and velocity adopts SIM PLEC algorithm, and momentum, turbulent kinetic energy and turbulent kinetic energy dissipation rate are discretized by the second-order upwind scheme.
The inlet boundary conditions are velocity inlet, turbulence intensity of 5% and hydraulic diameter of 0.05 m. The outlet boundary condition is the outflow boundary.
When the flow field analysis of the gate valve is carried out, the inlet velocity is 5 m/s, and the diameter of solid particles is 100 μm. The opening of the gate valve is set to 10%, 30%, 50%, 70% and 90% respectively. The solid-liquid two-phase flow method is used to simulate the erosion behavior in gate valves.
Results and analysis
1. Particle trajectories with different openings
According to the definition of valve opening, that is, opening = actual stroke/full-open stroke. The cross-sectional area of the valve flow section under different openings is calculated, and the cross-sectional area ratio of 10%, 30%, 50%, 70% and 90% opening is about 1:5:10:15:20. Assuming that the gate valve is leak-free, it can be considered that the flow of fluid into and out of the gate valve is strictly conserved: V1A1=V2A2 (7)
V1 is the average velocity of the valve inlet, m/s. A1 is the cross-sectional area perpendicular to the average speed direction, m2. V2 is the average velocity on the flow section of the valve, m/s. A2 is the flow cross-sectional area of the valve, m2.
It can be seen from formula (7) that the smaller the opening of the gate valve is, the greater the velocity through the bottom of the gate valve is, so the high-speed jet will appear in the downstream channel of the gate valve. When the opening is 10%, the average velocity on the flow section of the valve is about 20 times that of the inlet. The distribution of particle trajectories with different openings is shown in Figure 3.
From the chart of particle trajectory in Figure 3, it can be seen that the internal flow field of the gate valve is greatly influenced by the opening of the gate valve, and the particle trajectory changes sharply when the fluid flows through the gate valve, which is consistent with the theoretical situation of the flow conservation equation. When the opening is 10% and 30%, there is an obvious recirculation zone upstream of the shutter, but with the increase of the opening, the flow area of the fluid increases, and the velocity of the fluid passing through the lower end of the shutter decreases. When the opening is 70% and 90%, there is no obvious recirculation zone.
2. Erosion wear of different openings
The following figure is the distribution diagram of the erosion rate of gate valves under different opening conditions. It can be seen from Figure 4 that the valve opening has an influence on the degree and position of erosion wear. When the opening is 10%, the most serious position of erosion wear is located at the upstream end of the gate joint, and the erosion rate is the largest compared with other openings. When the opening of the gate valve is 30%, the erosion wear is mainly strip-shaped, and the upstream wall near the gate valve is the most widely distributed, but the maximum erosion rate is lower than the opening of 10%. This is because the flow cross-section of the gate valve increases, and the flow velocity of fluid decreases relatively. The disturbance to the movement of solid particles weakens. When the opening of the gate valve is 50% and 70%, the distribution of the two kinds of erosion wear is roughly the same, the erosion position is mainly concentrated near the gate valve, and the maximum erosion rate is similar. The reason is that the velocity change at the bottom of the gate is not much different when the opening of fluid is 50% and 70%. When the opening of the gate valve is 90%, the erosion wears mainly occurs at the bottom of the gate valve upstream of the runner, and there is no obvious erosion wear downstream of the runner. Generally speaking, under different opening conditions, the main erosion areas of gate valves are mainly concentrated at the bottom of gate valves and the sealing surface of gate valve seats.
Erosion rate under different opening conditions
Fig. 5 shows the change in the erosion rate of discs under different opening conditions. With the increase of the valve opening, the maximum erosion rate of gate valves shows a trend of first decreasing, then stabilizing and then continuing to decrease. When the valve opening is 10%, the erosion rate is the largest. When the opening is around 50%, the erosion rate has no obvious change. The above analysis shows that the erosion of gate valves is the most obvious in the process of opening and closing gate valves. In actual use, the opening and closing time of gate valves should be shortened as much as possible, so as to avoid leakage caused by erosion and wear accumulation of disc sealing surface. The above analysis also shows that the erosion wear phenomenon exists in the whole process of gate valves opening and closing, and the gate valve should not be used to regulate the flow in the field, so as to ensure that the gate valve is fully open or fully closed state and prolong the service life of the gate valve.
Fig. 5 The opening degree on erosion wear of gate valves
Conclusion
In this article, aiming at the erosion behavior of ultra-high pressure gate valves, the particle trajectory and erosion rate under 10%, 30%, 50%, 70% and 90% opening are analyzed, and the conclusions are as follows:
1. With the increase of the gate valve opening, the erosion rate will decrease at first and then remain unchanged.
2. The erosion rate of the gate valve is the largest during the opening and closing process.
3. During the opening and closing of the gate valve, there is erosion in the whole process of the gate valve, and the gate valve should be fully opened or closed as quickly as possible.
Next: Classification of Valves
Previous: 3D Printing Nuclear Safety Valves