Abstract: Fully welded ball valves offer advantages such as rapid opening and closing as well as reliable sealing, making them widely used in petrochemical, natural gas, and other industrial applications. The internal flow field significantly impacts the valve’s service life, and studying its distribution is critical for design optimization. In this study, a three-dimensional CFD model of a 1400 mm fully welded ball valve was developed to analyze the flow field characteristics at various opening angles, providing a theoretical foundation for improved valve design.
As a key component in pipeline systems, the performance of the valve directly affects the operational efficiency of the entire transport network. The flow characteristics within the valve are closely linked to its durability, prompting extensive research both domestically and internationally. With the advancement of CFD technology, numerical simulations of valve flow behavior have become increasingly sophisticated.
Li Li et al. investigated the flow behavior of metal-seated ball valves; Ying Zhao et al. analyzed flow separation in ball valves used in liquid rocket engines; Xiheng Zhang et al. studied the relationship between gas flow coefficient and valve opening; Shengchang Zhang et al. simulated the two-phase flow within outlet ball valves of oil-gas mixed pumps. Additional studies have focused on flow resistance, control performance, transient behavior, and other related phenomena.
Building on the actual structural design of the fully welded ball valve, this paper constructs a 3D fluid dynamics model of a 1400 mm valve core, focusing on the evolution of the internal flow field throughout the opening and closing processes. The findings serve as a valuable reference for the optimal design and performance enhancement of large-diameter ball valves.
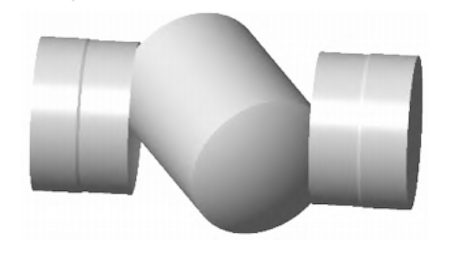
Based on the general design drawing of the valve body structure and considering the practical requirements for numerical simulation, the flow passage model of the ball valve is appropriately simplified. A geometric fluid domain model is then established for the ball valve chamber. To investigate the flow field distribution and its variation during the opening and closing process, fluid domain models are created for internal flow channels at opening angles of 75°, 45°, and 30° during both the opening and closing phases. The fluid domain model of the ball valve at an opening angle of 30° is shown in Figure 1.

Figure 1 Fluid domain model of a ball valve with an opening angle of 30°
The geometric fluid domain model of the ball valve is discretized using tetrahedral elements. The finite element models of the ball valve fluid domain at different opening angles, along with the corresponding mesh division, are shown in Figure 2.

Figure 2 Finite element model and mesh division of the ball valve fluid domain at different opening angles
The transport medium is natural gas, with a density of 0.6679 kg/m³ and a dynamic viscosity of 1.066×10⁻⁵ Pa·s. The inlet pressure of the natural gas is 0.6 MPa, and the outlet pressure is 0.59 MPa. During the closing process of the ball valve, due to the incompressibility of the medium, the flow rate in the flow channel remains unchanged at any given instant. As a result, the flow rate will increase, and the pressure will change instantaneously. However, once the flow field stabilizes, the pressure in the flow channel will reach a new equilibrium. This paper primarily simulates and analyzes the variation in the flow field distribution within the flow channel when the pressure is stable.
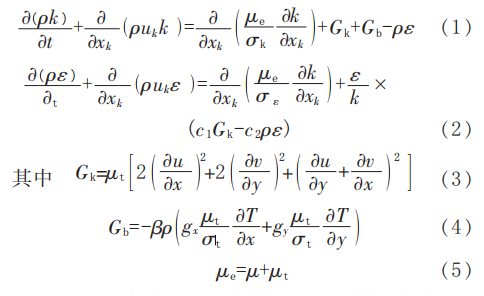
The widely used standard k-ε turbulence model in engineering is employed for the flow field analysis. The governing equations are as follows:


Where the parameters are defined as follows:
ρ: fluid density, kg/m³
k: turbulent kinetic energy, m²/s²
t: time, s
x-k: coordinate in the x-direction for the k-th phase
u-k: velocity component in the x-direction for the k-th phase, m/s
u: velocity component perpendicular to gravity, m/s
v: velocity component parallel to gravity, m/s
ε: dissipation rate of turbulent kinetic energy, m²/s³
c₁, c₂, C_μ, σ_k, σ_ε: model constants (1.44, 1.92, 0.09, 1.0, and 1.3, respectively)
G_k: generation of turbulent kinetic energy due to velocity gradients
G_b: generation of turbulent kinetic energy due to buoyancy
β: thermal expansion coefficient, 1/K
gₓ, gᵧ: gravitational acceleration components in the x and y directions, m/s²
T: temperature, K
μ: dynamic viscosity, Pa·s
x, y, z: spatial coordinates
Figure 3 shows the pressure cloud diagrams of the internal flow field at various opening angles during the valve closing process. As illustrated, the static pressure distribution can be divided into three distinct regions. When the valve is fully open, the highest pressure occurs at the inlet, followed by the pressure within the ball, and the lowest pressure is observed at the outlet. The most significant pressure fluctuation appears at the interface between the front of the ball and the valve body, where the pressure distribution is notably uneven.

Figure 3 Pressure of the ball valve flow field at different opening angles during the closing process
Figure 4 presents the cloud diagrams of flow velocity at different opening angles during the closing process. As shown, with decreasing opening angles, the internal flow velocity decreases from a maximum of 179 m/s to 128 m/s. These changes indicate that the transformation of the flow channel significantly affects the internal flow field.

Figure 4 Velocity of the ball valve flow field at different opening angles during the closing process
Figure 5 illustrates the streamline distribution of the internal flow field during the valve closing process. As the valve core rotates, the internal flow field changes dramatically, generating strong vortices. Since the medium is natural gas, the high flow velocity amplifies the flow instability. If solid particles are present in the gas, the turbulence can lead to severe erosion and wear on the valve wall.

Figure 5 Streamline distribution of the ball valve flow field at different opening angles during the closing process
By analyzing the valve closing process, the pressure drop and volumetric flow rate of the ball valve at various opening angles were obtained. The specific values are listed in Table 1.
Table 1 Fluid Parameters of Ball Valves at Different Opening Angles During the Opening and Closing Process
|
Opening Angle φ (°) |
Process |
Inlet Pressure (kPa) |
Outlet Pressure (kPa) |
Volume Flow (m³/h) |
|
30 |
Closing Process |
698 |
100 |
496,440 |
|
45 |
Closing Process |
680 |
100 |
1,184,400 |
|
75 |
Closing Process |
502 |
100 |
4,027,680 |
|
30 |
Opening Process |
502 |
100 |
496,440 |
|
45 |
Opening Process |
698 |
100 |
1,184,400 |
|
75 |
Opening Process |
680 |
100 |
4,027,680 |
The calculation formula of the flow coefficient Kv is:

Where:
qV is the volume flow rate, m³/h.
p1 is the inlet pressure, kPa.
γN is the flow resistance coefficient.
By substituting the simulation data into Equation (7), the flow coefficient Kv can be calculated. The corresponding flow coefficient Cv can then be obtained using the relation Cv=1.156Kv. The flow coefficients of the ball valve at different opening angles during the closing process at 15 °C are presented in Table 2.
Table 2 Flow Coefficients of the Ball Valve at Different Opening Angles During Opening and Closing at 15 °C
|
φ (°) |
Process |
Kv |
Cv |
|
30 |
Closing process |
20,409 |
23,593 |
|
45 |
Closing process |
49,979 |
57,776 |
|
75 |
Closing process |
230,227 |
266,142 |
|
30 |
Opening process |
20,409 |
23,593 |
|
45 |
Opening process |
49,979 |
57,776 |
|
75 |
Opening process |
230,227 |
266,142 |
As shown in Table 2, when the test pressure is 0.6 MPa, the flow coefficient of the ball valve increases with the opening angle during the closing process. Consequently, the pressure loss of the fluid flowing through the valve decreases.
The pressure cloud diagram of the internal flow field at different opening angles during the ball valve opening process is shown in Figure 6. As illustrated in Figure 6, when the outlet is at atmospheric pressure, the internal pressure within the valve body changes significantly throughout the opening process. Notable pressure fluctuations occur at the interface between the ball and the valve body on the inlet side, as well as inside the ball. A partial negative pressure is observed at the outlet. Once the valve is fully opened, the internal pressure distribution becomes uniform and stable. The velocity cloud diagram of the flow field inside the ball valve at different opening angles during the opening process is shown in Figure 7.

Figure 6 Pressure of the internal flow field at different opening angles during the opening process

Figure 7 Velocity of the internal flow field at different opening angles during the opening process
As shown in Figure 7, the velocity of the internal flow field increases gradually as the opening angle of the ball valve increases. When the valve is fully open, the maximum flow velocity can reach 1,420 m/s under a pressure differential of 0.6 MPa. Additionally, as the opening angle increases, the peak flow velocity rises and exhibits significant fluctuations. This indicates that, for natural gas media, changes in the flow channel have a considerable impact on the flow field.
The internal streamline distribution at different opening angles during the valve’s opening process is illustrated in Figure 8. As shown, the streamline distribution within the valve cavity is relatively chaotic, with numerous large-scale vortices forming inside the chamber. When the valve initially begins to open, many distinct vortices are generated. As the valve continues to open, the intensity of the internal vortex flow gradually diminishes.

Figure 8 Internal streamline distribution of the ball valve at different opening angles during the opening process
The ball valve's opening process was analyzed to determine the pressure drop and volume flow rate at different opening angles, as shown in Table 1. The flow coefficients of the ball valve at various opening angles during the opening process at 15 °C are presented in Table 2. It can be observed from Table 2 that, under a test pressure of 0.6 MPa, the flow coefficient of the ball valve increases continuously as the opening angle increases. As a result, the pressure loss of the fluid flowing through the valve decreases.
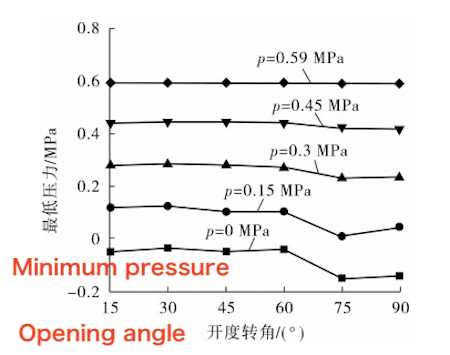
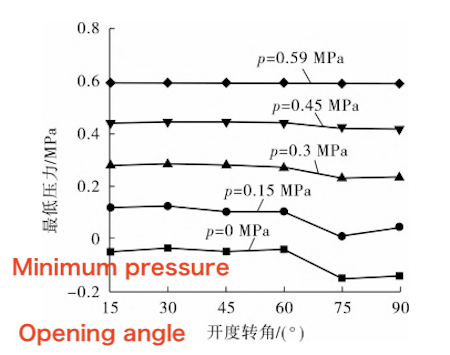
When the outlet pressure p of the natural gas medium varies, the trends in the minimum pressure and maximum flow rate of the ball valve at different opening angles are illustrated in Figures 9 and 10, respectively.
It can be seen from Figures 9 and 10 that as the outlet pressure of the medium increases, the minimum pressure within the valve gradually increases, while the maximum flow rate gradually decreases. Conversely, as the opening angle of the ball valve increases, the minimum pressure decreases, and the maximum flow rate increases. When the outlet pressure is 0.59 MPa, the variation in minimum pressure is relatively small.

Figure 9 The relationship between the minimum pressure and the opening angle of the ball valve at different outlet pressures

Figure 10 The relationship between the maximum flow rate and the opening angle of the ball valve at different outlet pressures
(1) During the closing process of the ball valve, the maximum flow velocity occurs near the ball outlet. As the opening angle increases, the high-velocity region gradually shifts from the center toward the valve wall, resulting in a larger impingement angle and intensified fluid-induced erosion.
(2) When the ball valve is fully open, the streamlines within the flow channel are evenly distributed, resulting in minimal erosion of the valve wall. However, during the opening and closing process, vortex flows are generated inside the valve, which can reduce the partial pressure and lead to bubble formation, creating conditions favorable for cavitation in high-pressure zones.
(3) During the opening process, when the valve opening is small, negative pressure occurs at the outlet. As the opening angle increases, the negative pressure gradually decreases and disappears completely once the valve is fully open. However, the overall pressure difference across the valve remains high, accompanied by significant pressure fluctuations. Flow velocity is very high during the opening phase and increases with the opening angle, causing the most severe fluid-induced damage to the valve. This condition typically lasts only briefly in actual operation and is considered an extreme working condition. At the moment the valve is opened, pressure loss decreases as the opening angle increases.